Between 2013 and 2015, Upworthy ran thousands of headline tests. For each story, editors wrote several headlines, readers were randomly shown one, and the clicks were counted. The tests were later released for research as the Upworthy Research Archive, split into an exploratory part and a confirmatory part.
I wanted to know how often those winners were real. So I built the analysis on the exploratory part, wrote the plan down, locked it in git, and then ran it once on the 22,743 tests in the confirmatory part. Everything below comes from that run.
First, some tests weren't random at all
The archive's authors published a correction: tests from late June 2013 to early January 2014 weren't properly randomised. The data agrees. In a fair test each headline gets roughly the same number of readers, and inside that window 70% of tests fail that check. Outside it, 0.5% do. I dropped the window, which left 17,836 tests.
Most tests couldn't see what they were looking for
Separating real differences from luck (more on how below), the typical true difference between two headlines is about 0.19 percentage points of click rate. The typical test needed a difference of about 0.74 points, a 63% relative lift, to detect it reliably. Only 0.08% of tests were big enough to catch the typical effect.
That doesn't make the tests useless. It means they could find a headline that was dramatically better, and not much else.
Looking early
A common habit is to watch a test and stop as soon as it looks significant. I simulated 20,000 tests with no real difference at Upworthy's own click rates and sizes, and checked after every batch of readers.
Checked once, 4.9% falsely "win", as they should. Checked 10 times, 18.7%. Checked 100 times, 30.6%.
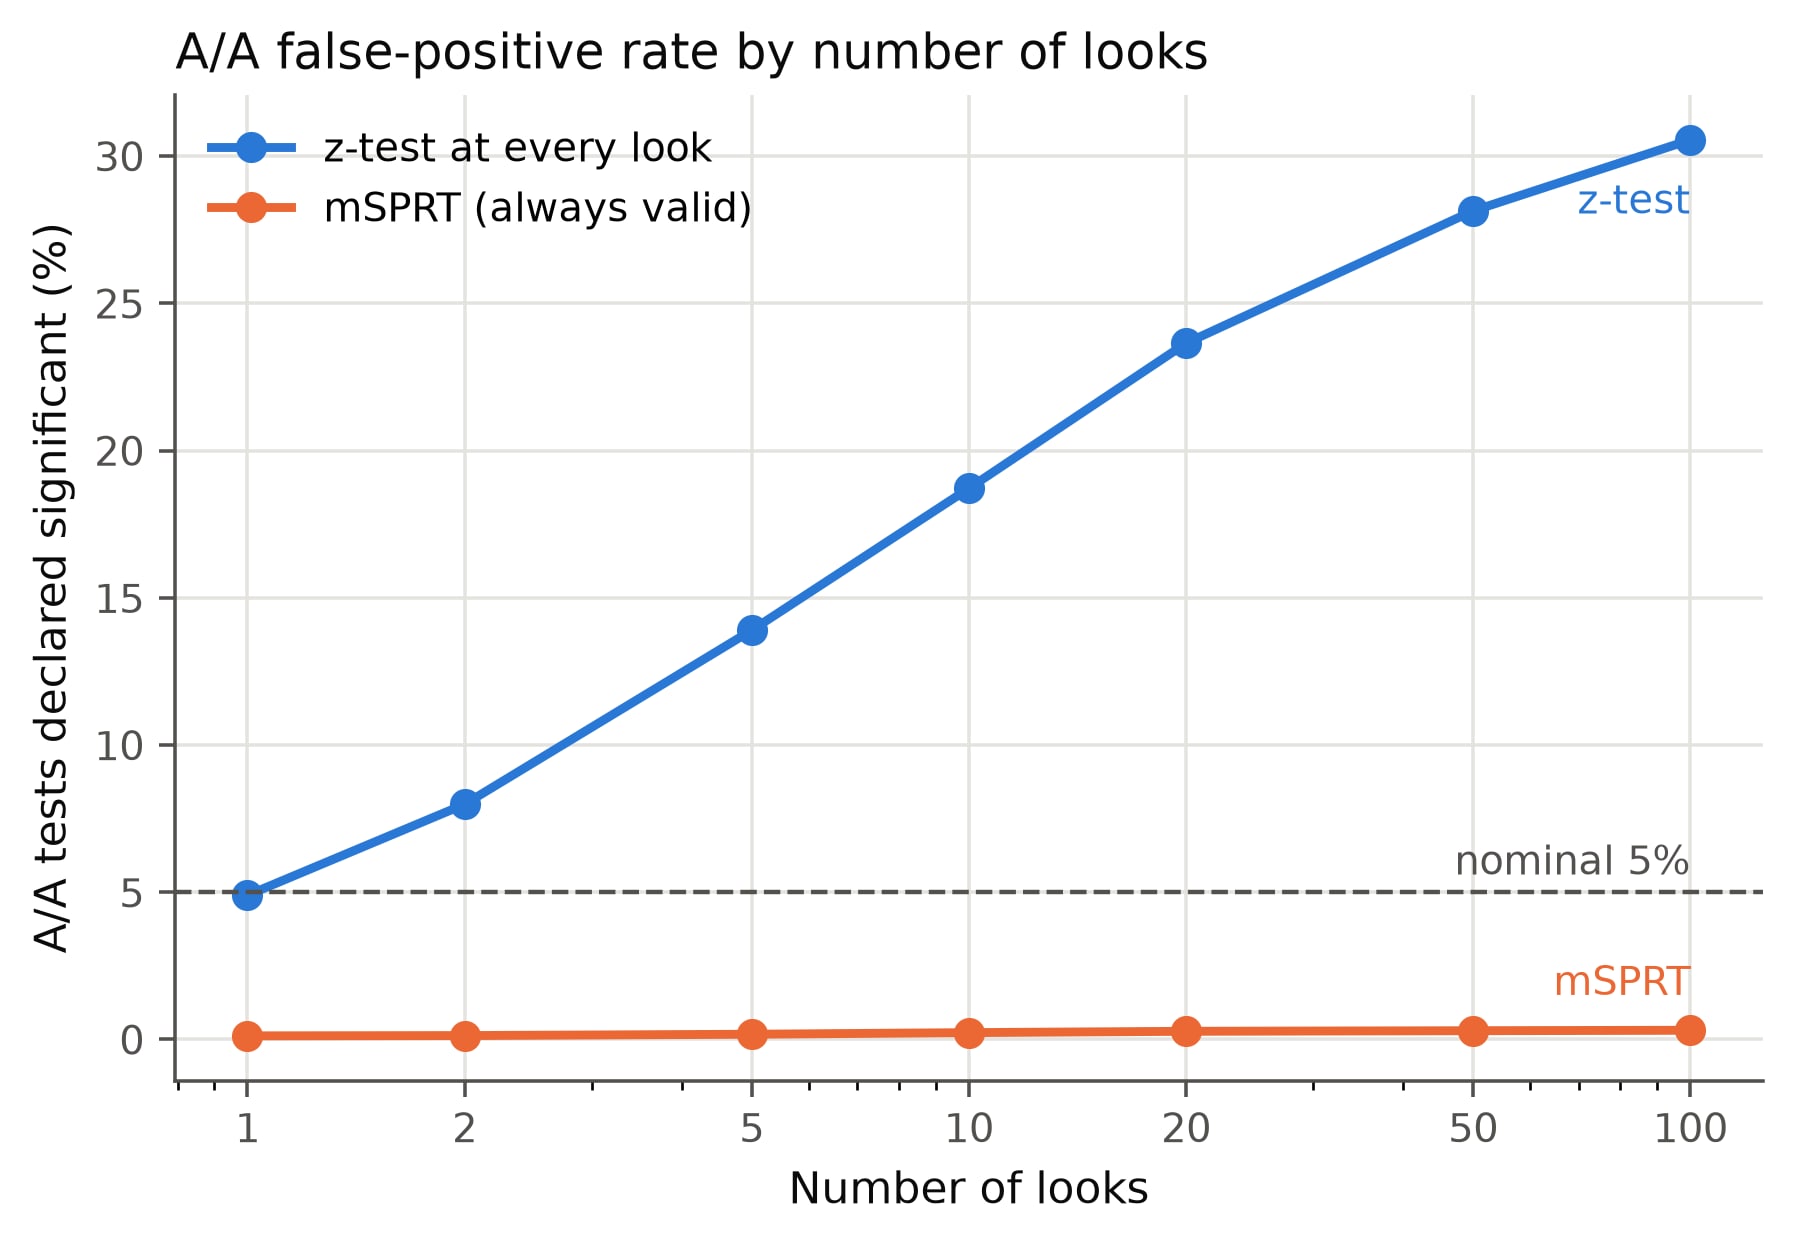
There are tests designed to be checked continuously. The one I used kept false wins below 0.4%. But at these sizes it also found much less: a headline that was truly 50% better was found 13% of the time, against 53% for a single check at the end. If you can't afford a valid sequential test, decide when you'll look before you start, and only look then.
The winner's curse
3,820 tests had a headline that beat the first one at p < 0.05. Picking winners that way also picks up luck, so a re-run would usually show a smaller lift. How much smaller?
Empirical Bayes gives an estimate: learn from all 67,851 comparisons what true effects tend to look like, then judge each winner against that and its own noise. The median significant winner shrinks by about 40%. The more surprising the win, the more it shrinks. One test shows 8 clicks from 115 readers against 1 from 111, a 6-point lift with p = 0.02. Its best estimate after shrinkage is 0.07 points.
Only 38% of the significant winners have at least a 95% chance of truly being better than the headline they beat.
The A/A test nobody planned
While building this, I noticed that some tests contain two arms showing exactly the same headline, image and excerpt. That's an accidental A/A test: 2,011 pairs of them in the confirmatory data. About 5% should differ at p < 0.05. 12.9% do.
So clicks vary between identical arms almost twice as much as the standard model assumes, and I can't tell from the data why. If that extra variation is real, the usual standard errors are too small, and the shrinkage is closer to 88% than 40%. I'm treating that as a warning rather than a result, but it's the finding I'd most like someone to explain.
What I'd take from it
- Check the randomisation before the results. It's the cheapest test there is.
- Work out what your test can detect before running it.
- Decide when you'll look, or use a test made for looking often.
- Expect a significant winner to do worse next time.
The case study has the charts, the replication table and a second experiment, where a standard variance-reduction method did almost nothing. The code and the locked plan are on GitHub.